The Rate of Perceived Exertion (RPE) is a subjective yet powerful tool that helps athletes gauge workout intensity, offering key insights into internal load and recovery needs. Apps like Nix Solo pair RPE with metrics like workout duration, sweat rate, and electrolyte loss to deliver a comprehensive view of performance and effort. Tracking RPE consistently enables athletes and coaches to tailor training sessions, avoid overtraining, and optimize hydration and fueling strategies.
What is RPE?
The Rate of Perceived Exertion (RPE) is a subjective method for measuring how hard an individual feels that they are working during a physical activity. It was developed by Gunnar Borg, a Swedish psychologist, and it is commonly used in both sports and clinical settings.
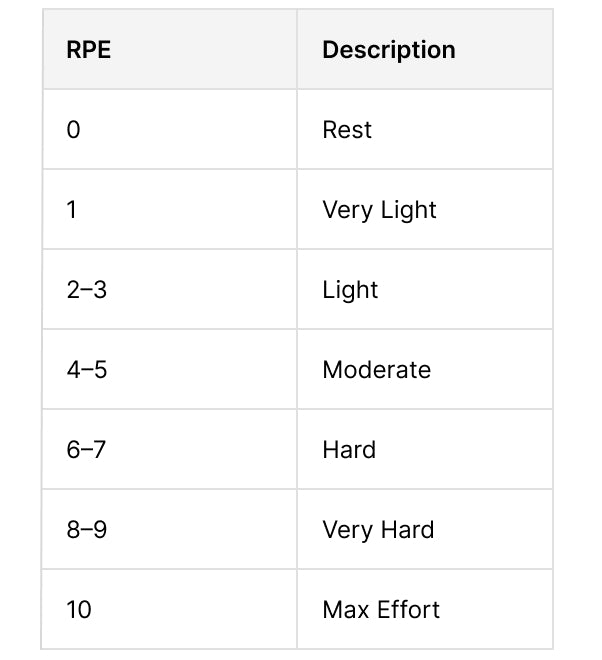
The original Borg RPE scale utilized values from 6 - 20, which were designed to correlate roughly with heart rate (e.g., an RPE of 14 when multiplied by 10 would roughly correspond to a heart rate of ~140 bpm). The Modified Borg CR10 RPE scale (or simply, Modified RPE scale) was adapted and easier to use in most practical settings. This scale ranges from 0 to 10, with 0 being rest and 10 being maximal effort.
The RPE scale in the Nix Solo app ranges from 1 to 10, reflecting the requirement that users must be actively sweating to generate data—meaning their exertion level is always at least a 1.
How to Measure RPE
The following chart shows the typical breakout of RPE. Athletes normally rate their exertion immediately after a session based on how they felt during the workout.
If using a Garmin watch, some models will prompt you to complete a self evaluation after a workout. You’ll be asked to provide your perceived effort (scale of 1-10) and how you felt (a series of smiley faces).
Importance of Measuring RPE
There are multiple reasons why tracking RPE can benefit an athlete during training. Working with a coach can help some athletes to identify their ideal training plan. Benefits of monitoring RPE include:
⬢ Tracking Load & Fatigue: coaches monitor RPE to track internal load (how the session felt) versus external load (what was done, like distance or weight). For example, a Session RPE would be calculated by the RPE x Duration (in minutes). This provides a training load metric - example RPE 7 × 75 min = 525 units. This helps prevent overtraining and reduce injury risk.
⬢ Developing Individualized Training: athletes have different fitness levels and cardiovascular form. Therefore, two athletes doing the same exact workout may rate them differently. One athlete may rate it a 5 while the other gives it an RPE of 8. These measures provide intel to the coach who can adapt training plans to each individual’s recovery or fitness levels.
⬢ Self-Regulation: in the absence of a coach, individuals can utilize the RPE from workouts to adjust their own training loads based on how they feel during a workout. This method helps in managing fatigue and reducing the risk of overtraining. It also has applications beyond just running and cycling - such that it can be applied to strength training too.
⬢ Monitoring: when tracking RPE over time, RPE trends begin to emerge. A steady rise in RPE for similar sessions could signal accumulated fatigue. Conversely, declining RPE for the same workouts could indicate the need to adjust training plans. For example, a marathon runner would use RPE in his training plans - with different estimated RPEs for easy runs versus. interval training.
Nix Users and RPE
Like many other training devices and aids, Nix users have the ability to add RPE to their workouts. Simply click on a workout tile, and select the pencil to edit the workout. This allows an athlete to adjust their pace, fluid intake, add notes, tags and record RPE. We looked further into workouts that had a recorded RPE to identify trends and insights surrounding this metric.
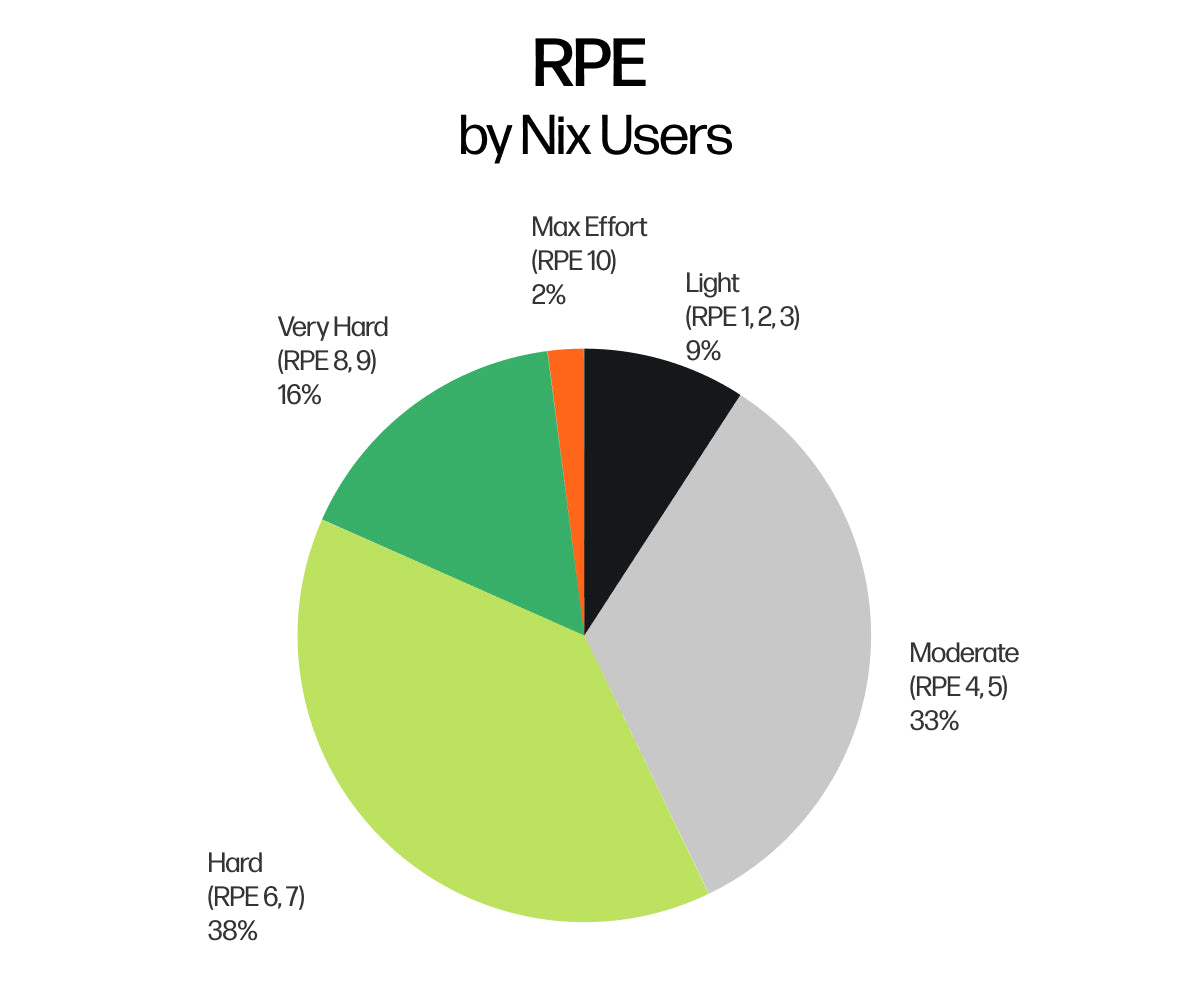
More than half of the workouts recorded are at a moderate effort (RPE of 4, 5 or 6). Similarly, only 2% of workouts are recorded at max effort (RPE of 10) and 9% at light effort (RPE of 1, 2 or 3). This varies very little by gender, however we see males are more inclined than women to record an RPE of 10.
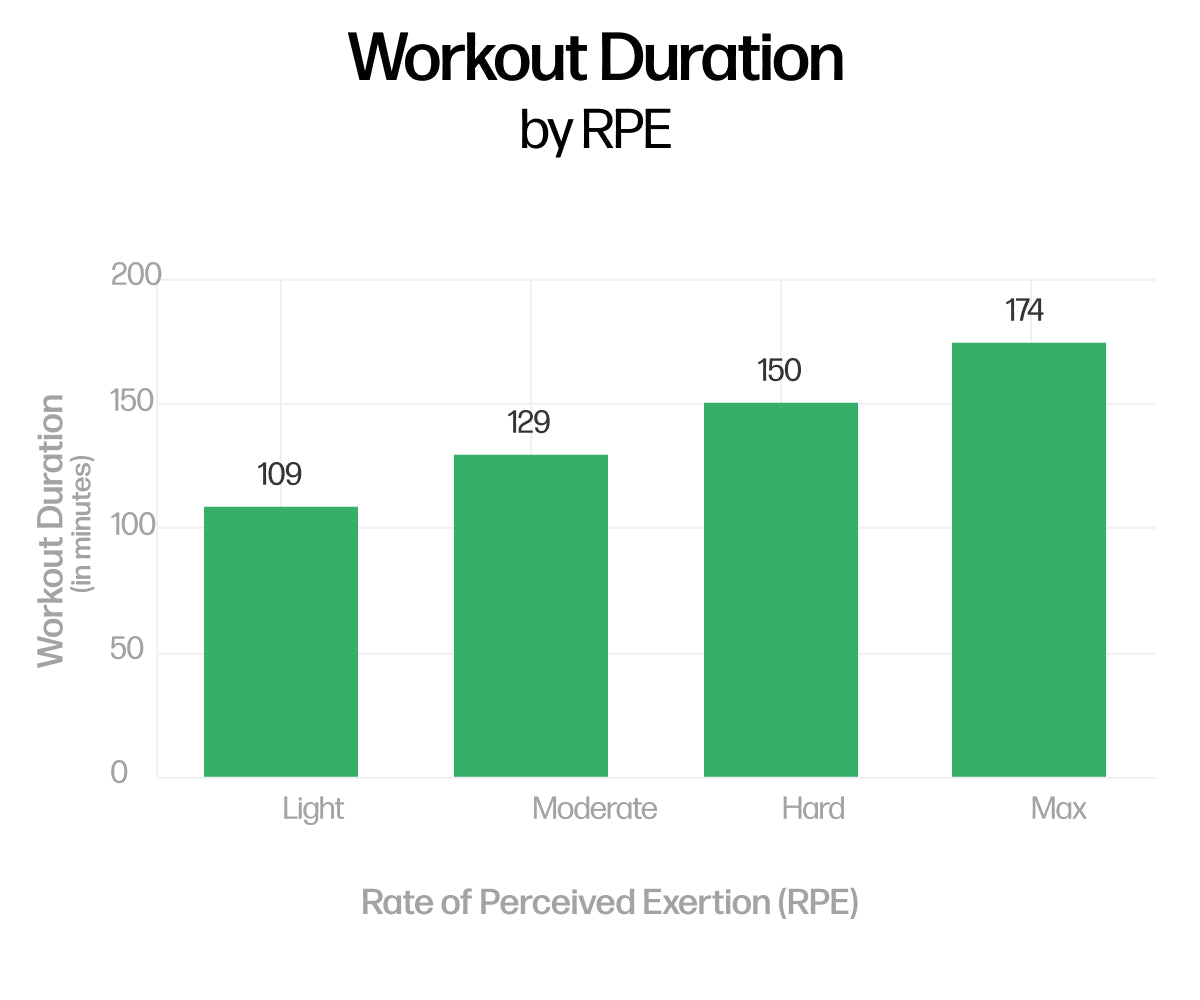
Interestingly, the duration of the activity increases roughly 17% for each RPE category. Meaning, a user with a high RPE (7, 8, or 9) will exercise approximately 17% longer than a user with a moderate RPE (4, 5, or 6).
RPE, Sweat Rate and Electrolyte Loss
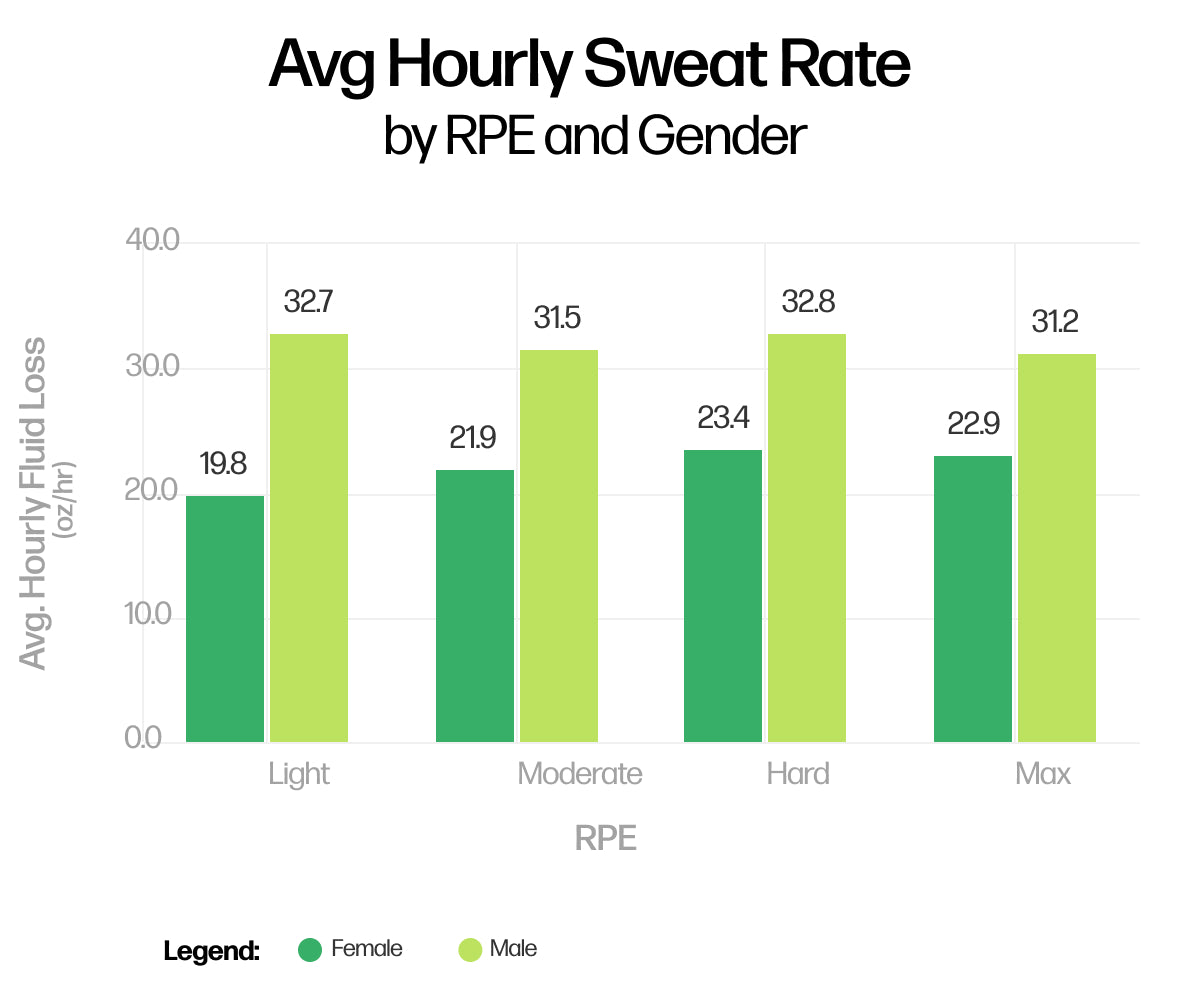
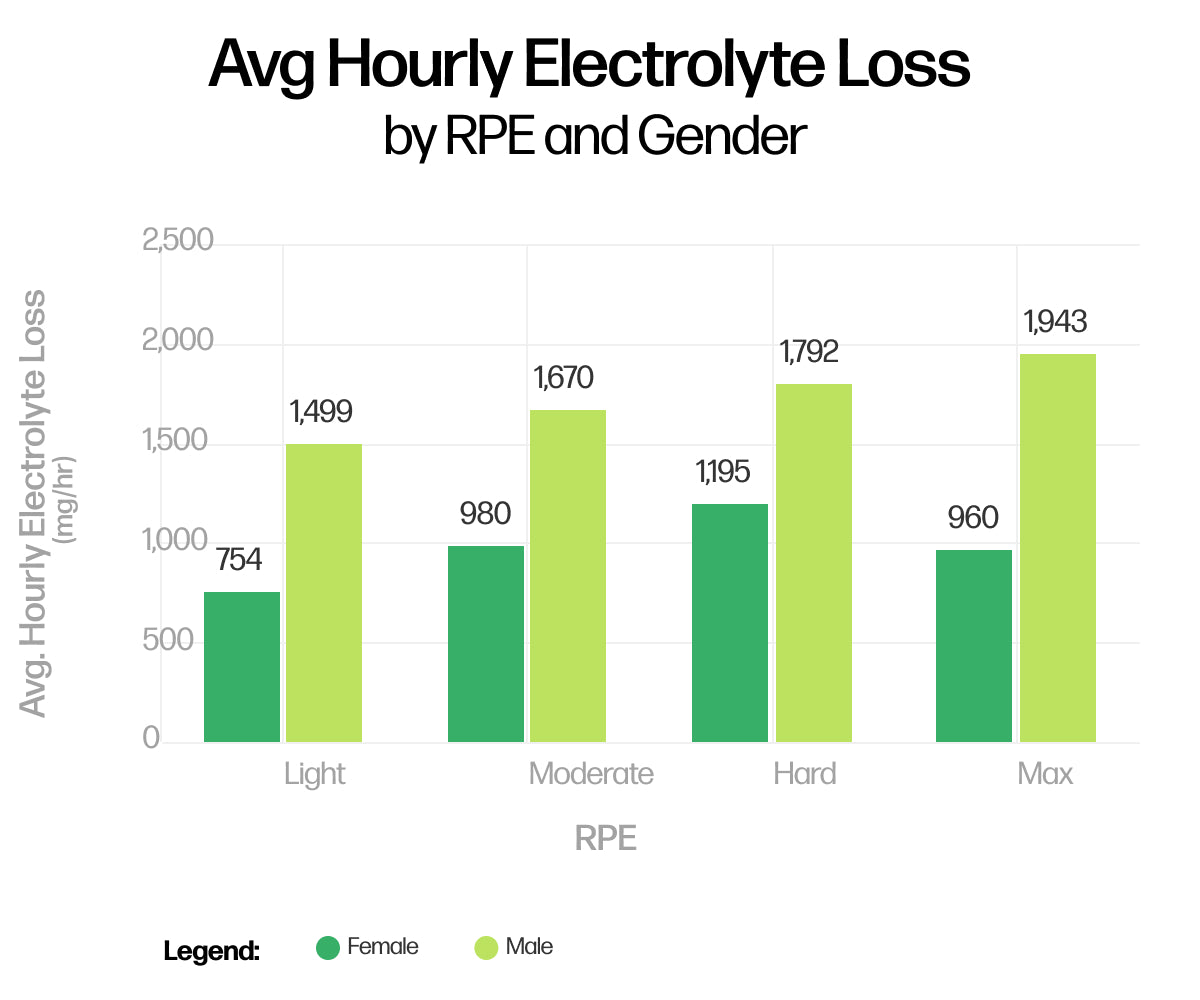
When examining average hourly sweat rate, particularly in males, there is very little change between light RPE and max RPE. The average hourly fluid losses have a maximum variability of approximately 1.5 ounces.
Conversely, the variation in average hourly electrolyte loss is more pronounced as the RPE category increases. Electrolyte needs for females increase 22-30% per RPE category threshold while for males it increases 7-11% per category band (note that there are limited female data points for max effort). Putting that into practical application, that means a moderate RPE workout for a female requires approximately 226mg more electrolytes per hour than a light workout (980mg/hr during moderate RPE vs. 754mg/hr during light RPE). That’s just slightly more than a Gatorade Zero. For a male athlete, the difference between a max effort workout (RPE 10) and a light workout (RPE 1, 2, or 3) is 444mg of electrolytes per hour - that’s nearly the amount of electrolytes in a Hydralyte Tablet or a Skratch High-Carb powder serving.
Application for Athletes
Providing an RPE within training tools such as Nix Solo, Garmin, Strava and TrainingPeaks allows athletes to provide a subjective way to track how they felt during a recent workout and overlay the metric with their objective data points as well. As Triathlete magazine astutely points out, users might perceive the same effort as harder or easier on a different day for any number of reasons – fatigue level, illness, weather, even mental fatigue. Recording your RPE allows you and your coaching team to gain another powerful metric used to help adjust your training plans accordingly.
Additional Reader Notes
Do you have a hydration topic that you want to see us cover? Send us a note to info@nixbiosensors.com and we’ll add it to our list of upcoming article content.
Data for this article was compiled based on gender, workout length and activity type (cycling and running) for workouts from November 2023 through March 31, 2025. This data range was selected to ensure all workouts included the option of editing RPE which was introduced in October 2023. Only workouts of at least 30 minutes in length are included within the dataset.


