Nix Hydration Biosensor Science and Validation
Nix Hydration Biosensor Science and Validation


Proprietary Nix Biosensors research.
The Nix Hydration Biosensor was rationally designed to measure specific biomarkers in the sweat. Nix’s proprietary machine learning algorithms take several steps to extrapolate the raw data into end user insights. These algorithms have been trained and validated on an extensive data set collected in controlled settings. This paper summarizes that vast body of validation work.
The Nix sweat patch is the culmination of several critical features designed to capture raw electrochemical data from the sweat as it is secreted (Figure 1).
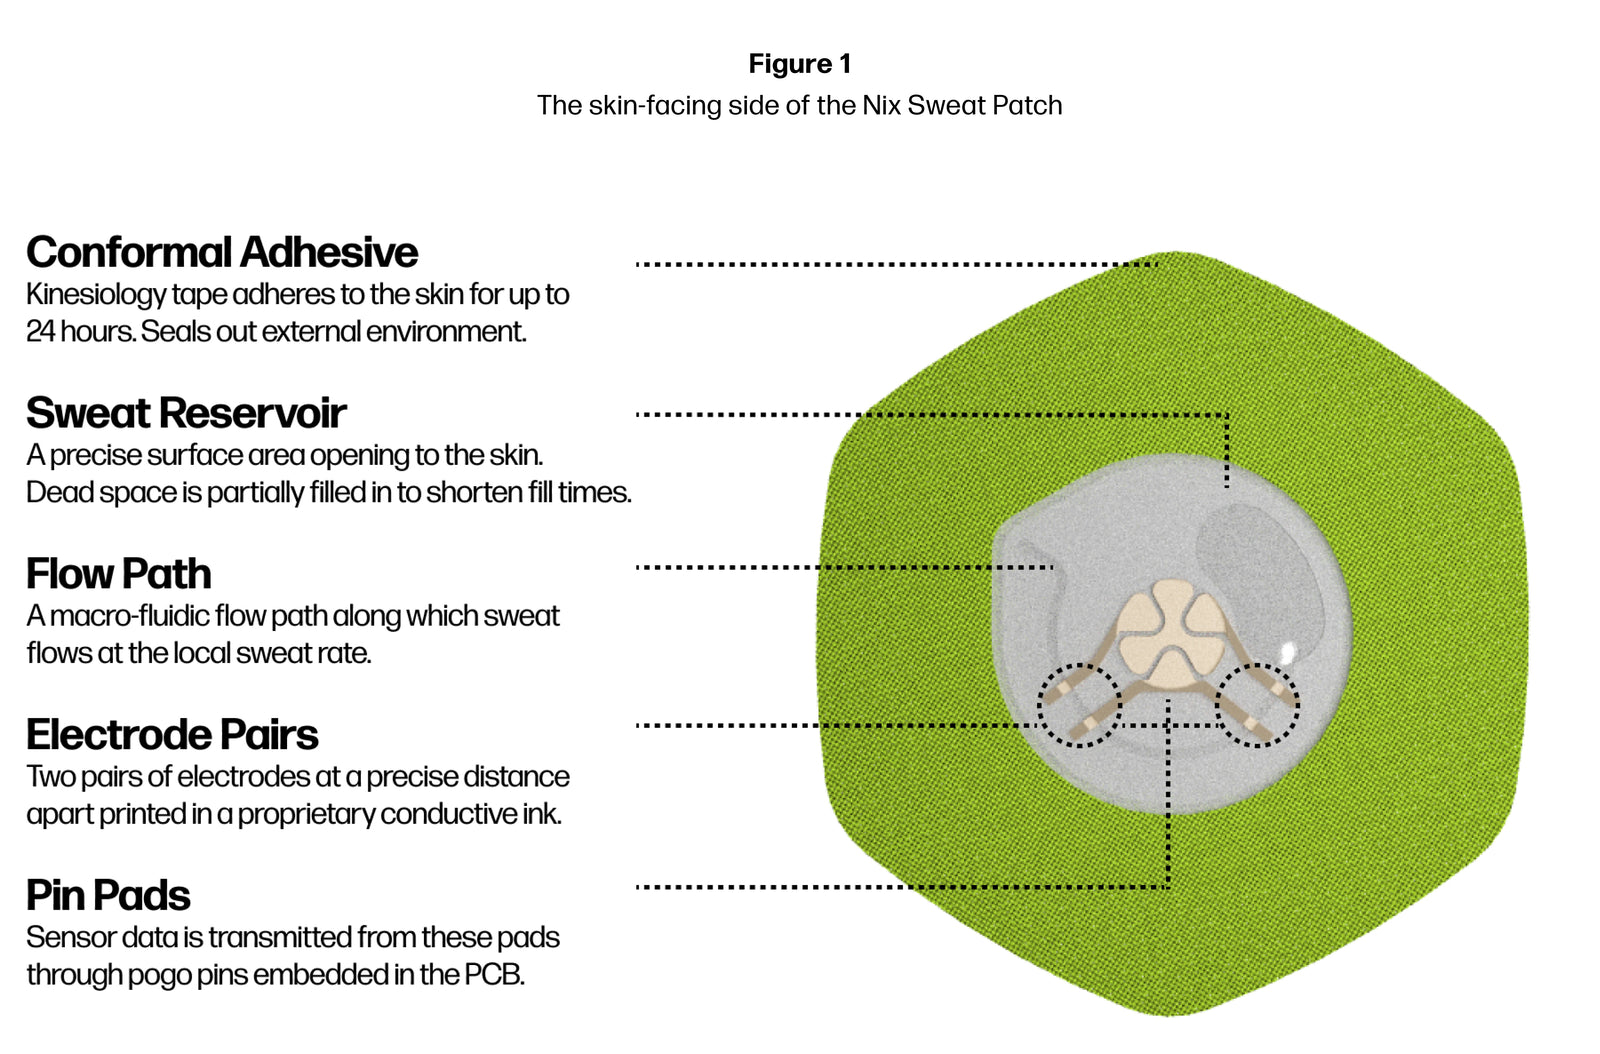
Figure 1. The skin-facing side of the Nix sweat patch.
Sweat fills the reservoir, continuously travels down the flow path, and freely exits the flow path through an outlet, unlimited by time or sweat volume. As the sweat passes through, two pairs of electrodes (powered by the Nix Pod which connects pogo pins to the pin pads on the patch) each measure the ionic potential – or electrical impedance - of the sweat, capturing the naturally-occurring microfluctuations in electrolyte composition. Measuring the sweat each second in both locations – Impedance 1 and Impedance 2 – creates a time series of data in each location in the flow path (Figure 2).
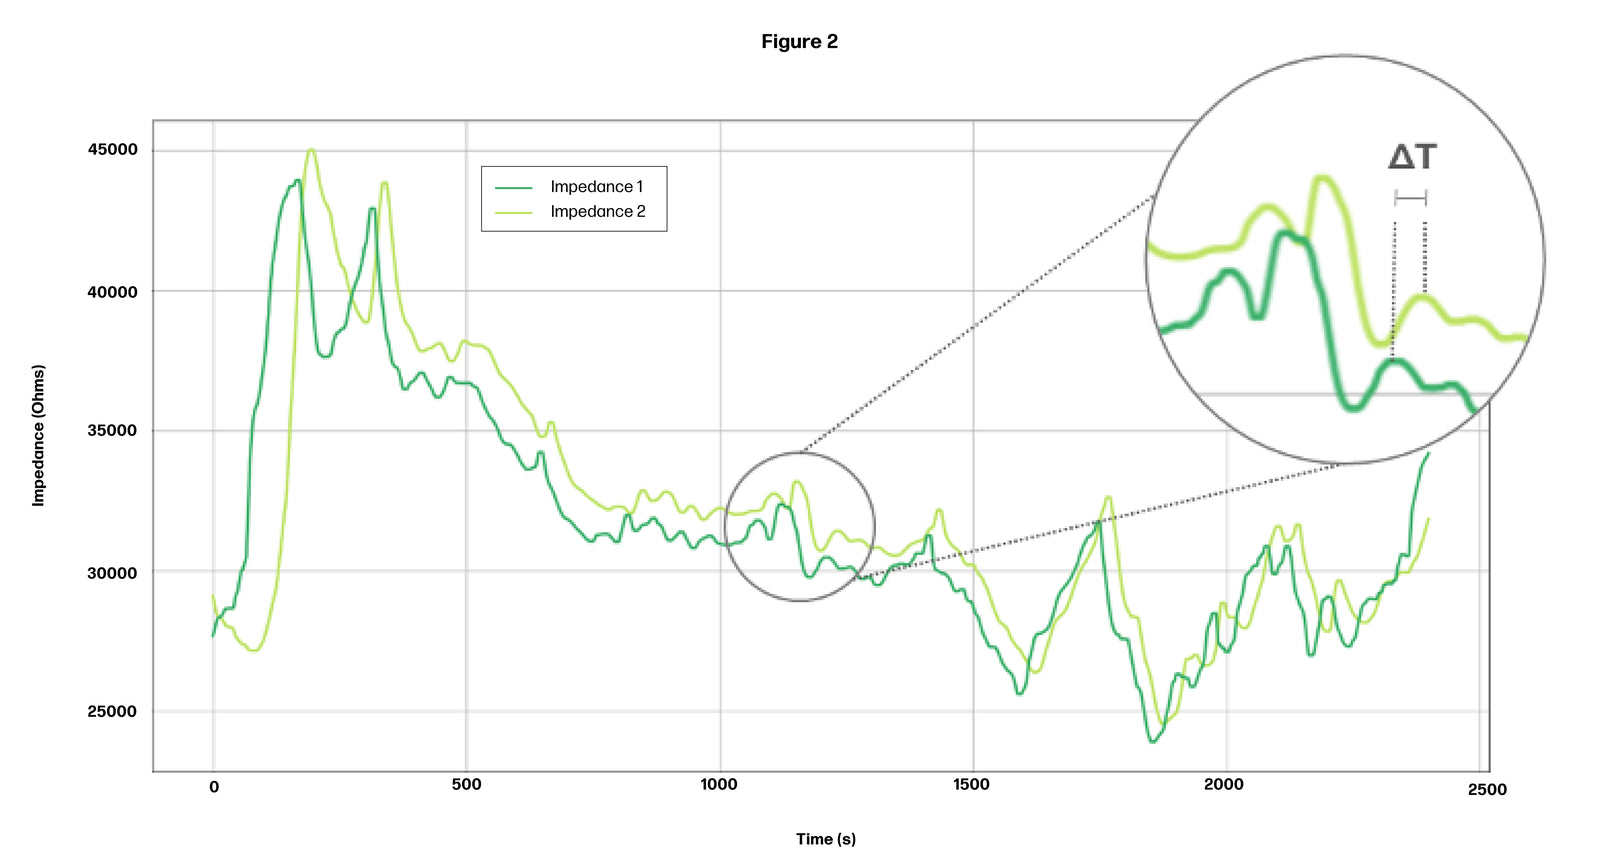
Figure 2. Sample time series data at Impedance 1 and Impedance 2.
The impedance value of the sweat (i.e. on the y-axis) is ultimately extrapolated to the electrolyte concentration. The time it takes for sweat to travel from the first pair of electrodes to the second pair of electrodes (i.e., on the x-axis) represents the sweat rate on the bicep where the patch was placed. On the timeseries graph, this is represented by the ΔT between the two timeseries.
To validate that our sensor accurately measures electrical impedance, we tested our sensor’s impedance measurements against fixed resistors at 13 different resistance levels on the benchtop. The comparison of our sensor’s measured value to the fixed resistor produced a perfect R2 = 1 (Figure 3). Variations across several sensor units resulted in standard deviations of 0.1% to 0.27%; or precision of 99.7% to 99.9% (Figure 4).
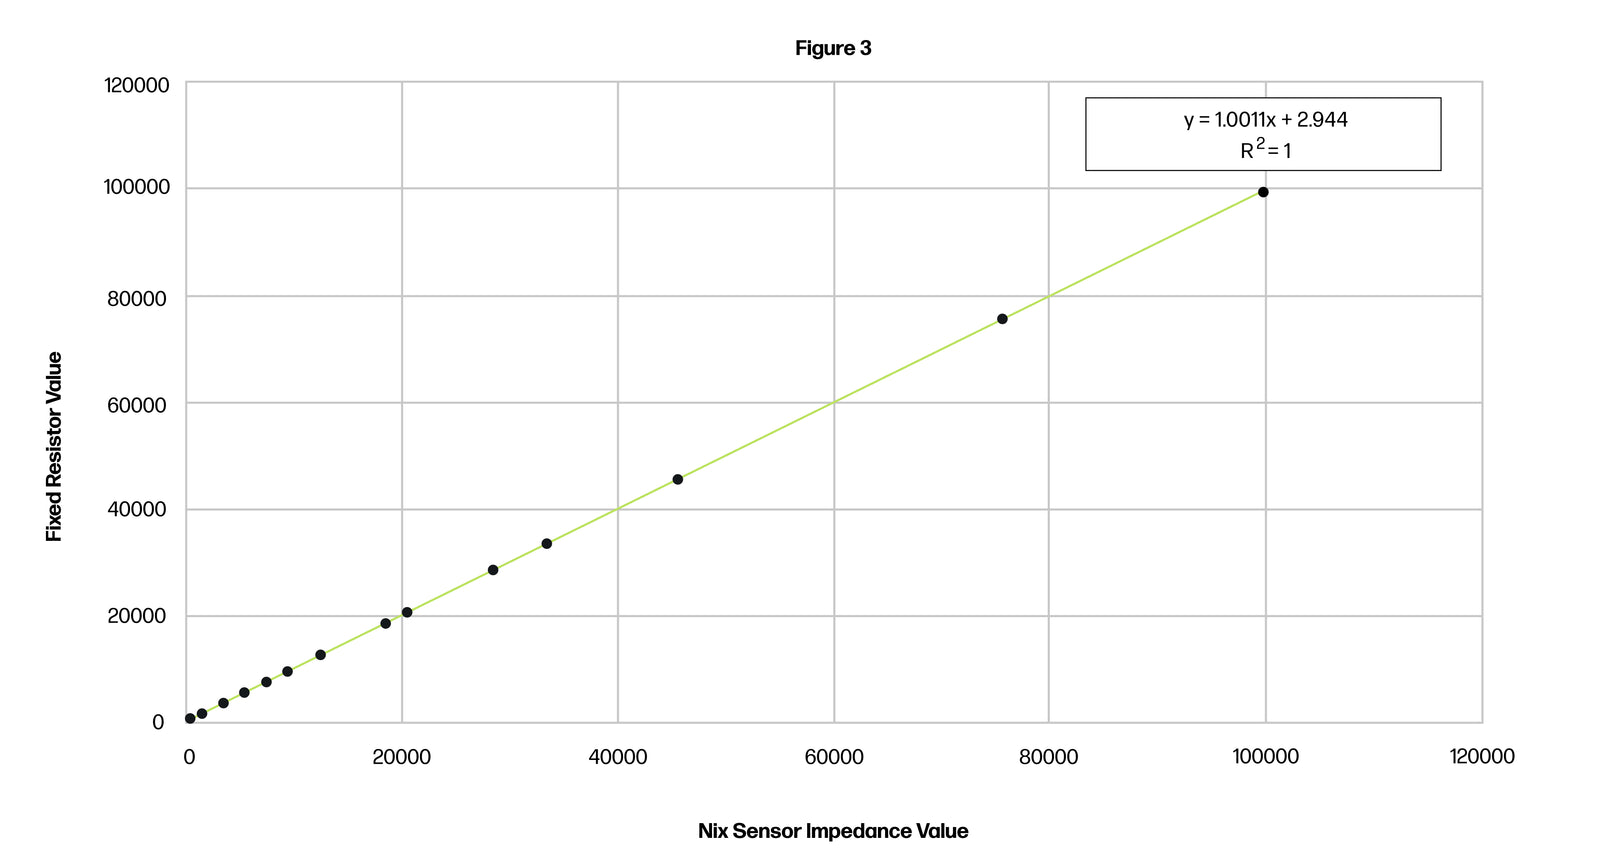
Figure 3. Comparison of impedance value from Nix sensor versus fixed resistors.
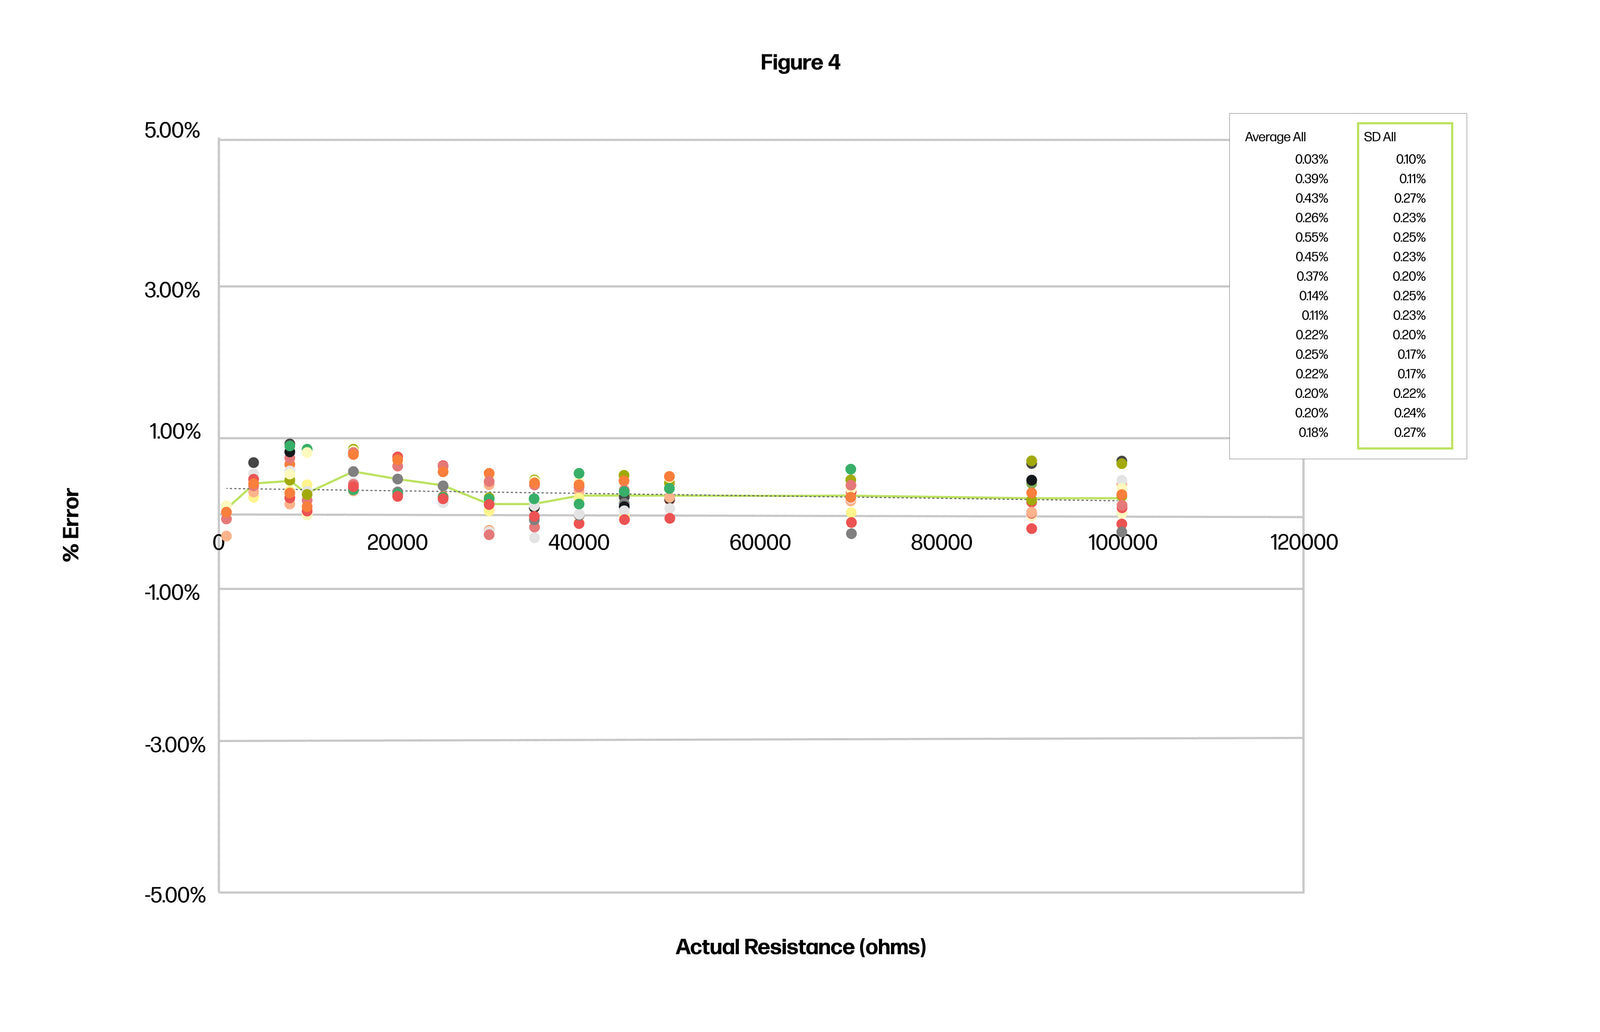
Figure 4. Precision analysis of Nix sensor versus fixed resistor.
Impedance is a temperature sensitive metric which must be normalized before further algorithmic processing. To establish this temperature correction algorithm, a temperature sweep was performed in an environmental chamber from 10 60⁰C (50-140⁰F) while the sensor was running with a control solution of known electrolyte content. Impedance values were recorded (Figure 5. The equation that describes the best fit line is the temperature-correcting algorithm (Figure 6. Note: the proprietary algorithm equation is redacted). The precision of the temperature correction algorithm was then assessed, producing a Mean Average Percent Error (MAPE) of 99.8% (Figure 7).
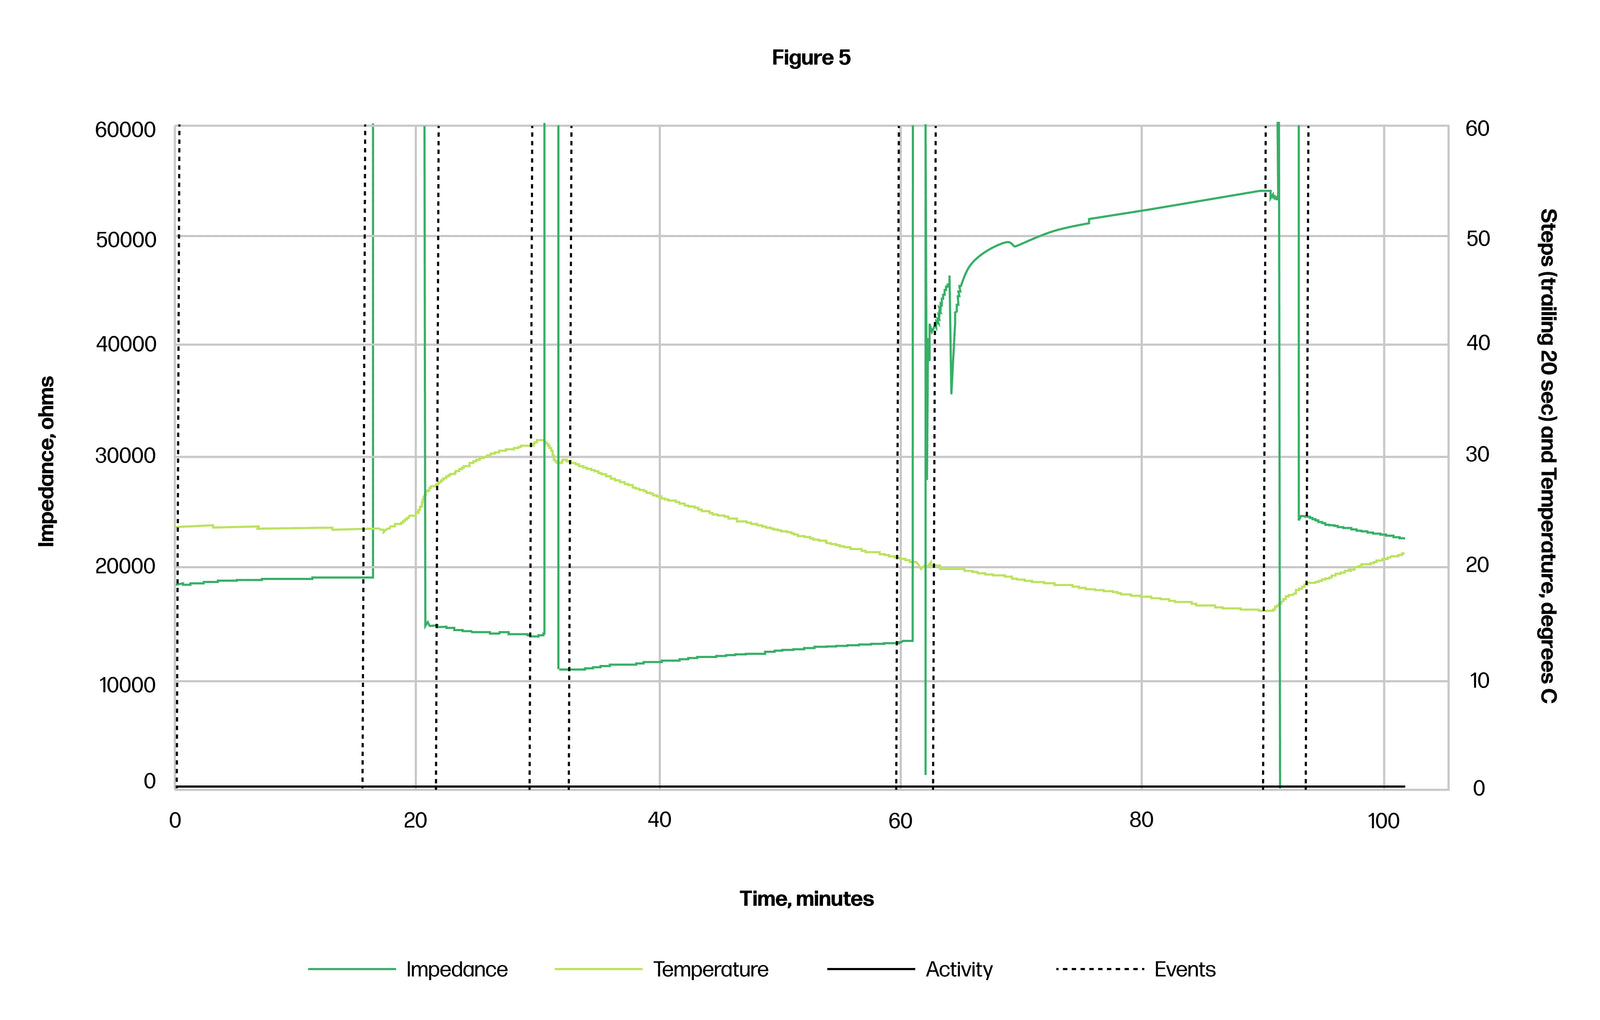
Figure 5. Raw data for temperature sweep performed in heat chamber.
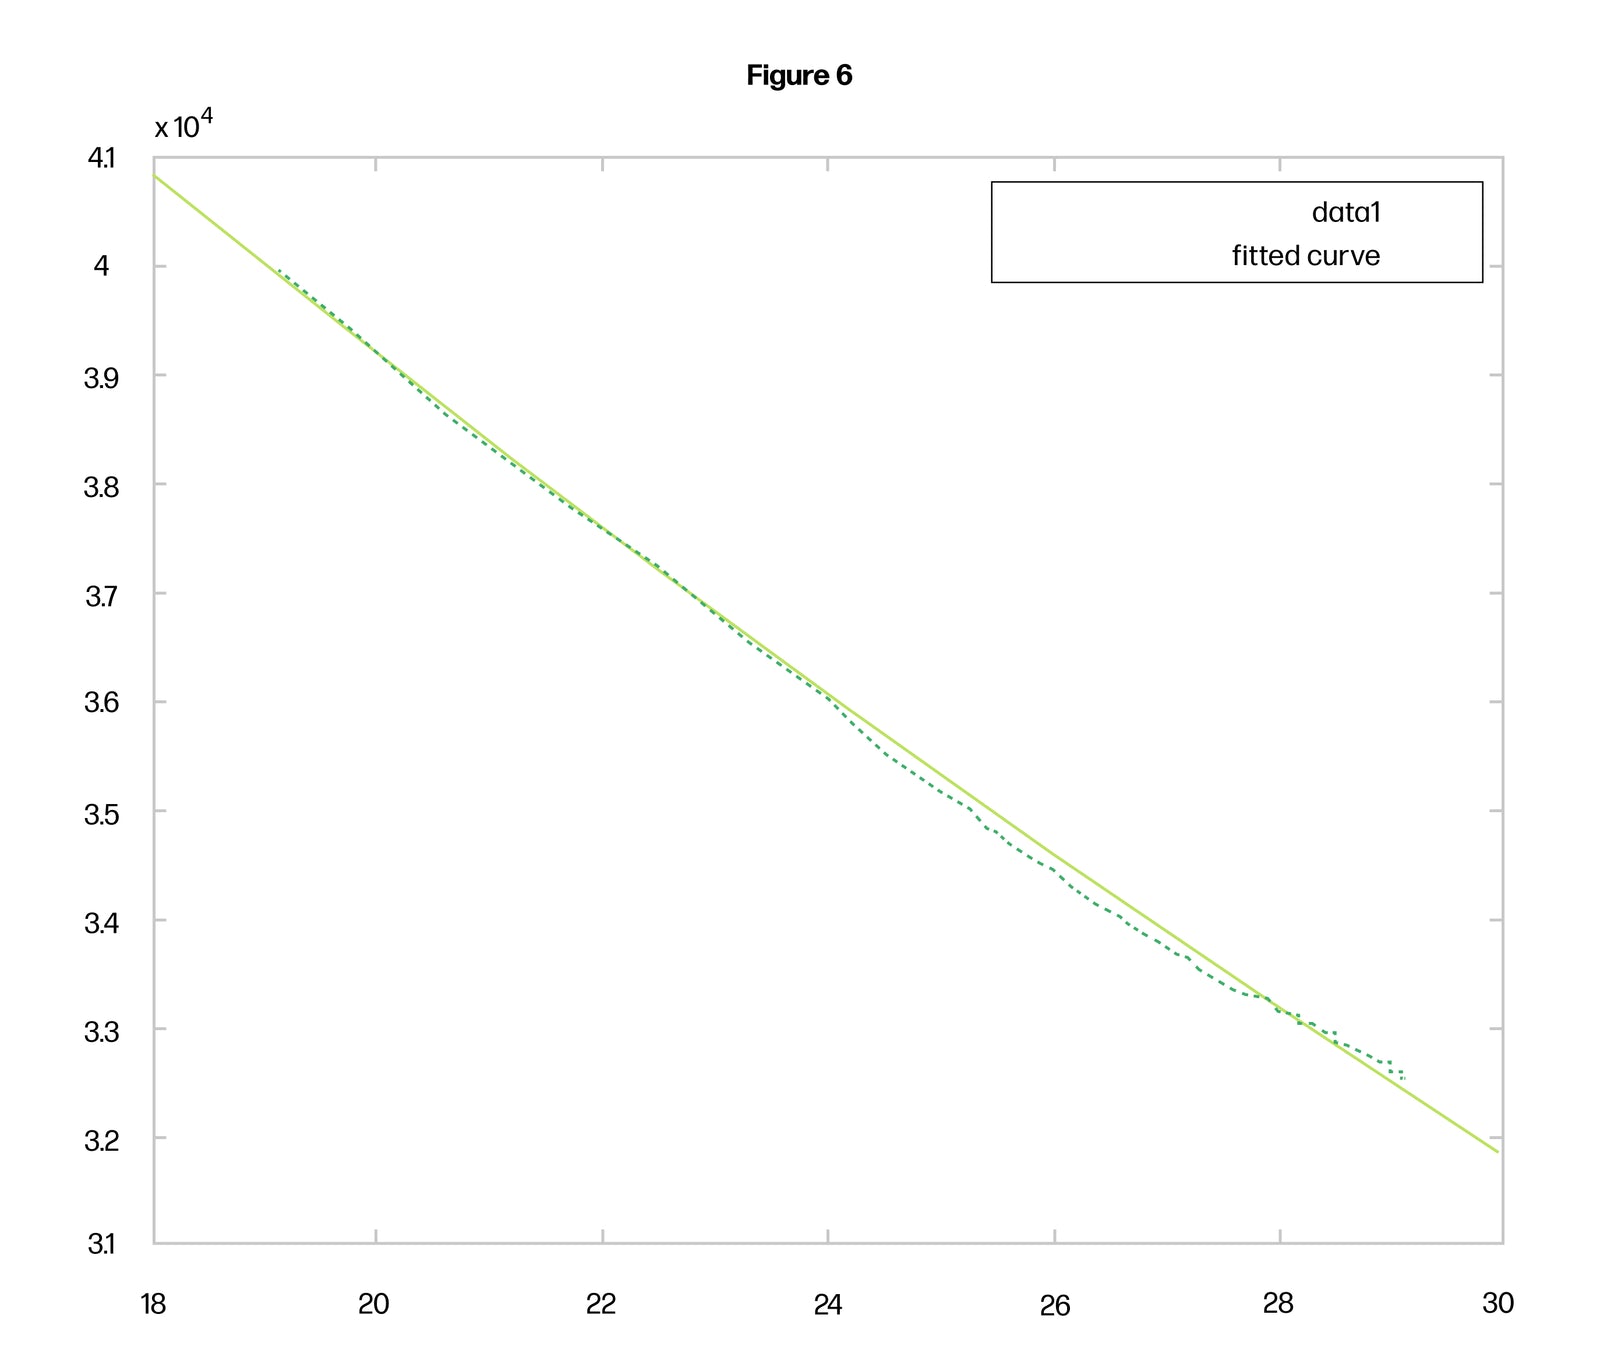
Figure 6. During model for temperature sweep, the equation that describes the best fit line is the temperature-correcting algorithm.
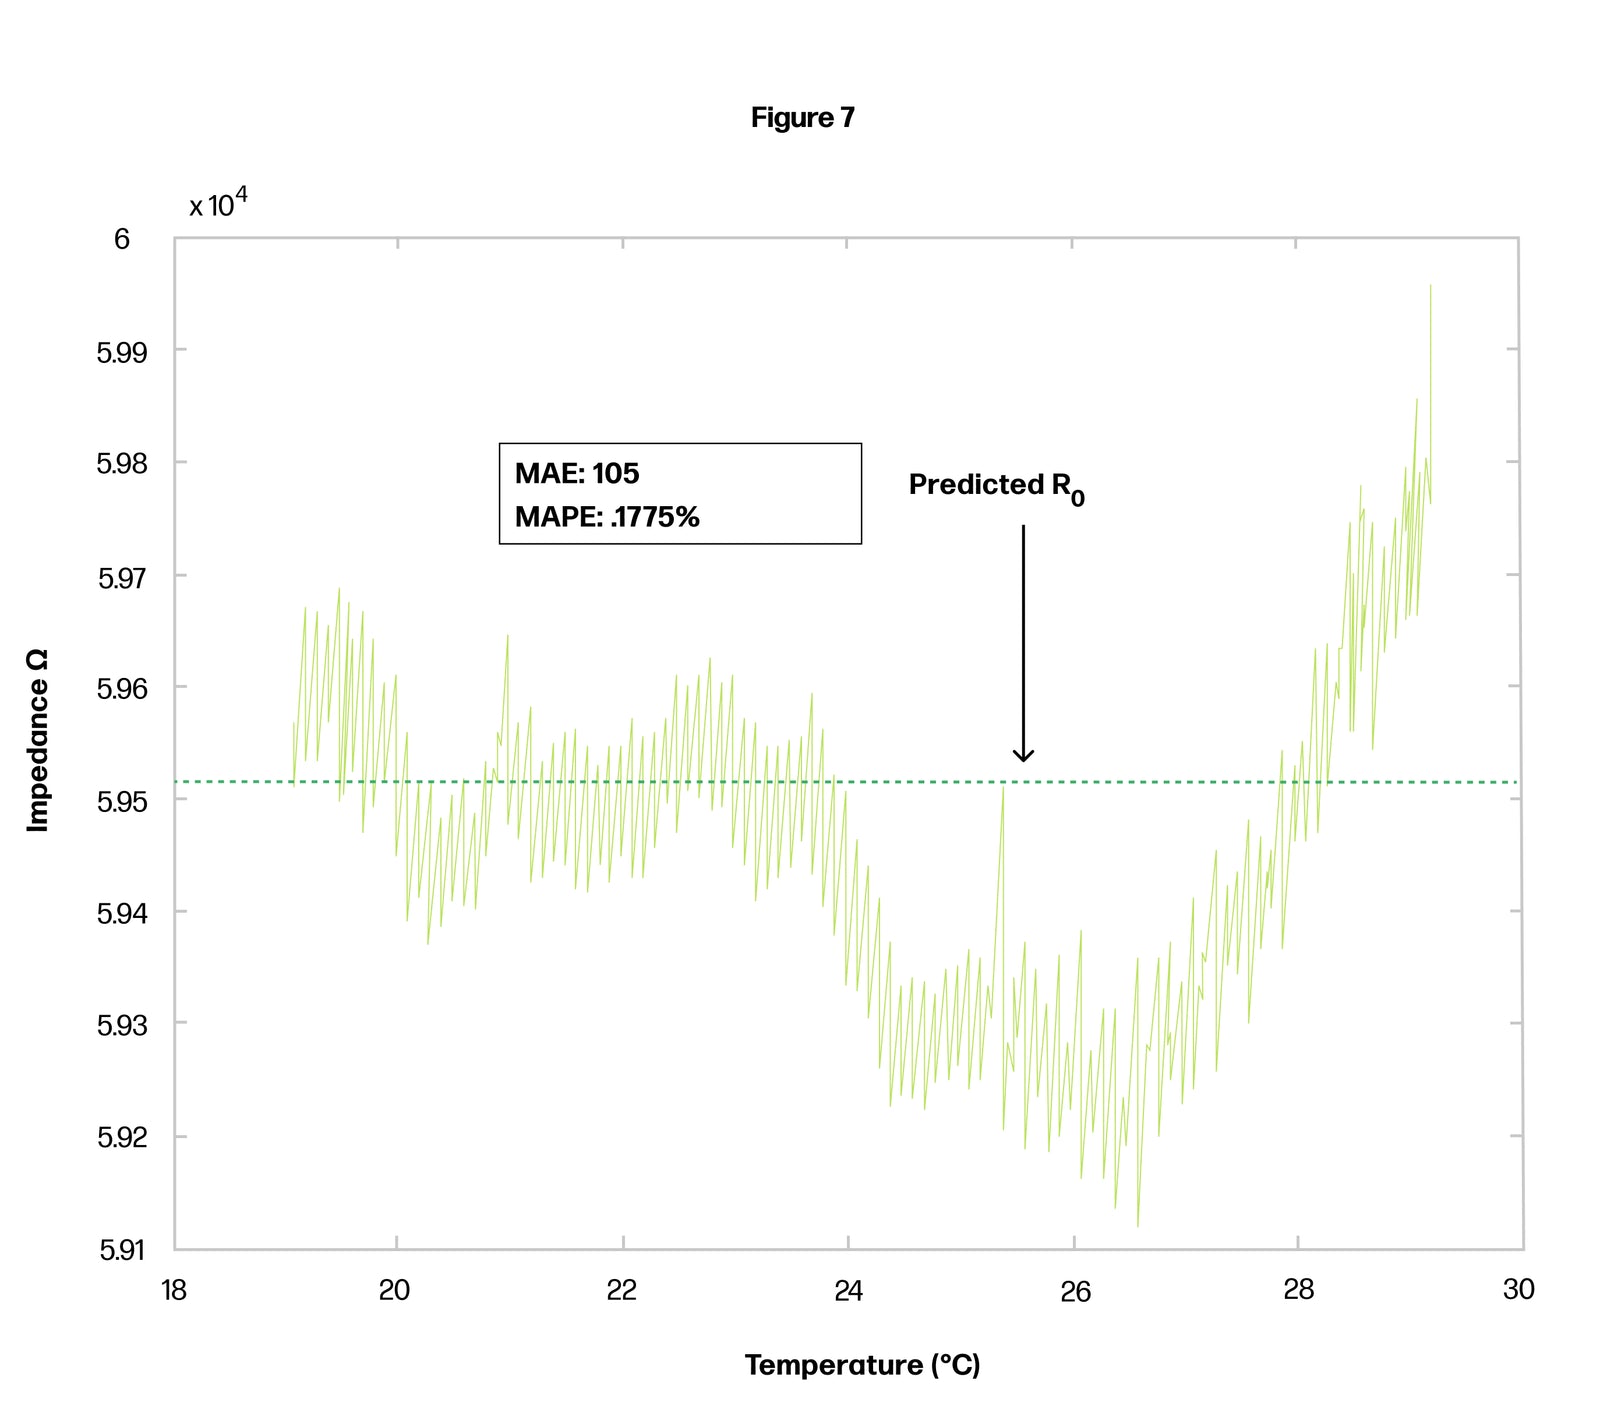
Figure 7. Algorithm produced a predicted value of 59,520 ohms. (The precision of our algorithm is 99.8%).
Once temperature-corrected, the normalized impedance values are extrapolated to the osmolality of the sweat. To establish this algorithm, control solutions of known osmolality (i.e., electrolyte content) were pumped through the sensor with an injection pump on the benchtop using several different sensor units, and several different disposable units. The equation of this curve is the algorithm to convert our temp-adjusted impedance to osmolality (Figure 8. Note: The proprietary equation has been redacted.). The best-fit curves show precision of 97.3%.
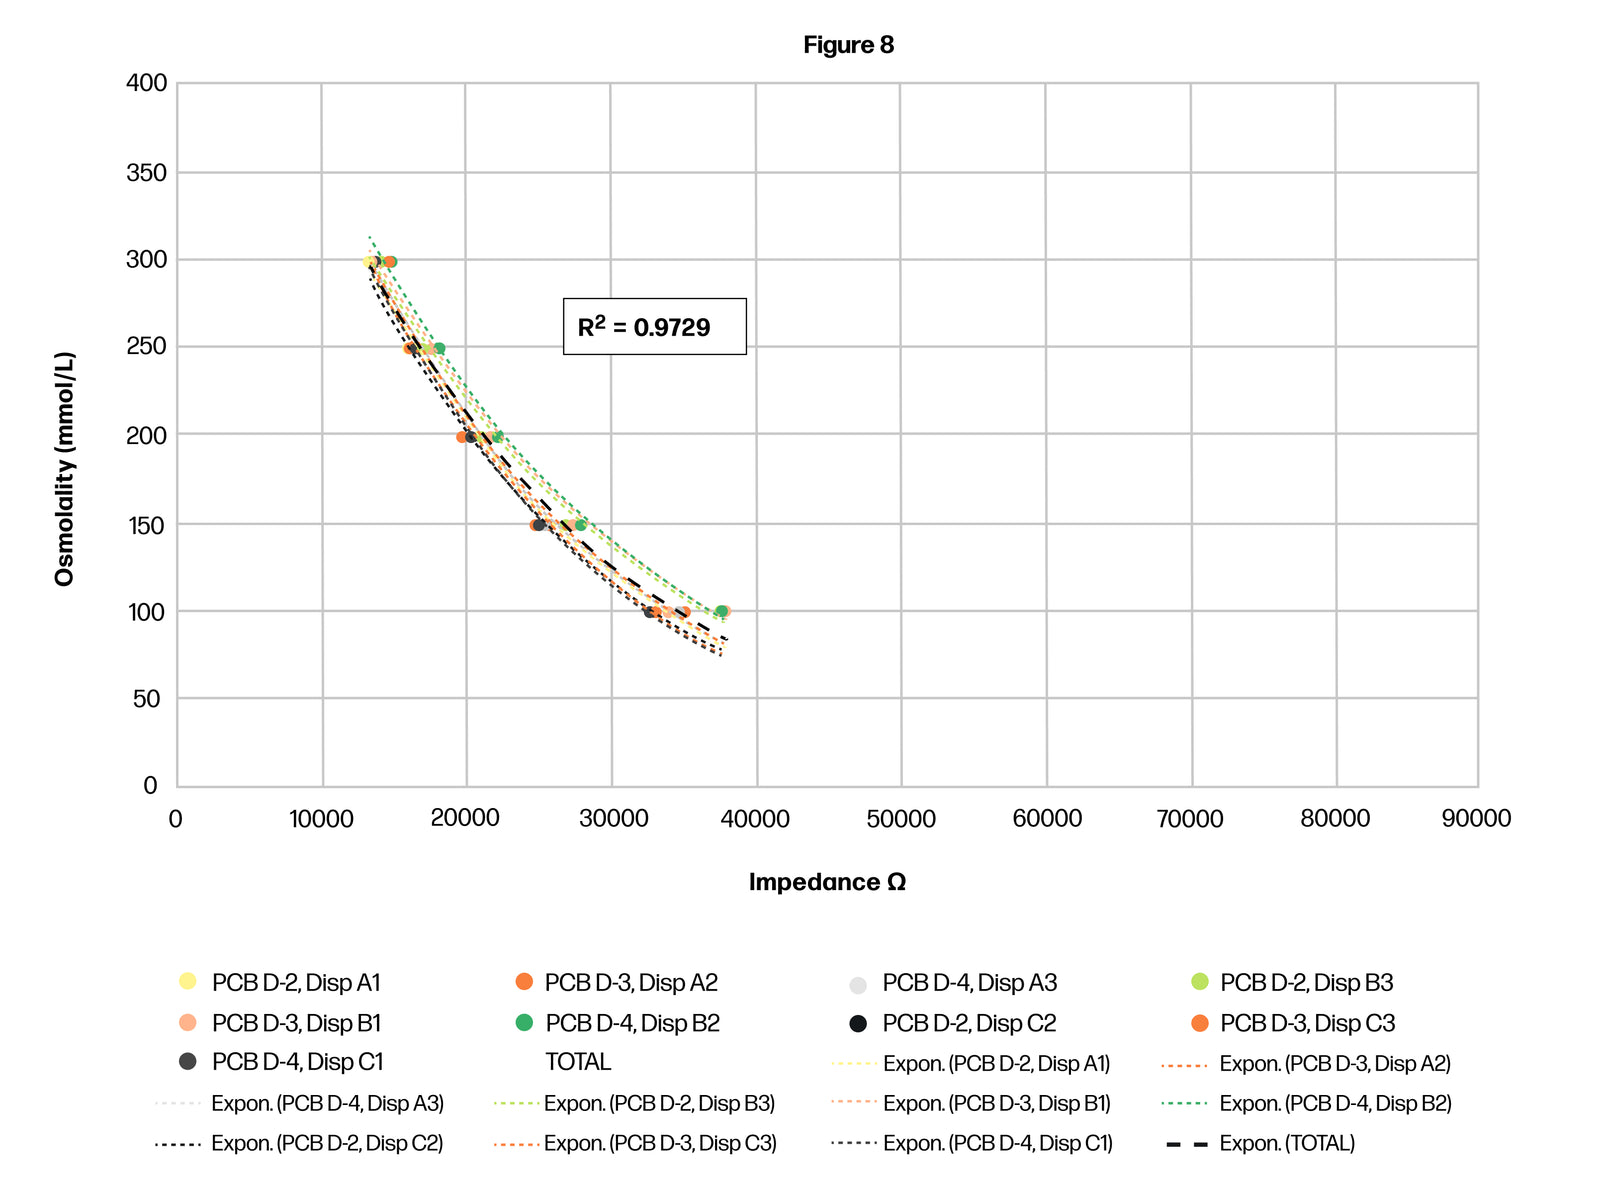
Figure 8. Establishing the osmolality algorithm by correlation of impedance to control solutions of known osmolality.
To further validate this algorithm, a blinded osmolality test was conducted with control solutions of known osmolality, and raw impedance values were recorded. Our sensor and algorithms converted the raw data to temperature-corrected osmolality for a measured value as compared to actual osmolality value (Figure 9). The actual and predicted values produce a mean absolute percent error (MAPE) of 1.7% (Figure 10), or precision of 98.3%. Osmolality is then converted to milligrams of electrolytes (in aggregate) for reporting to the user through the app.
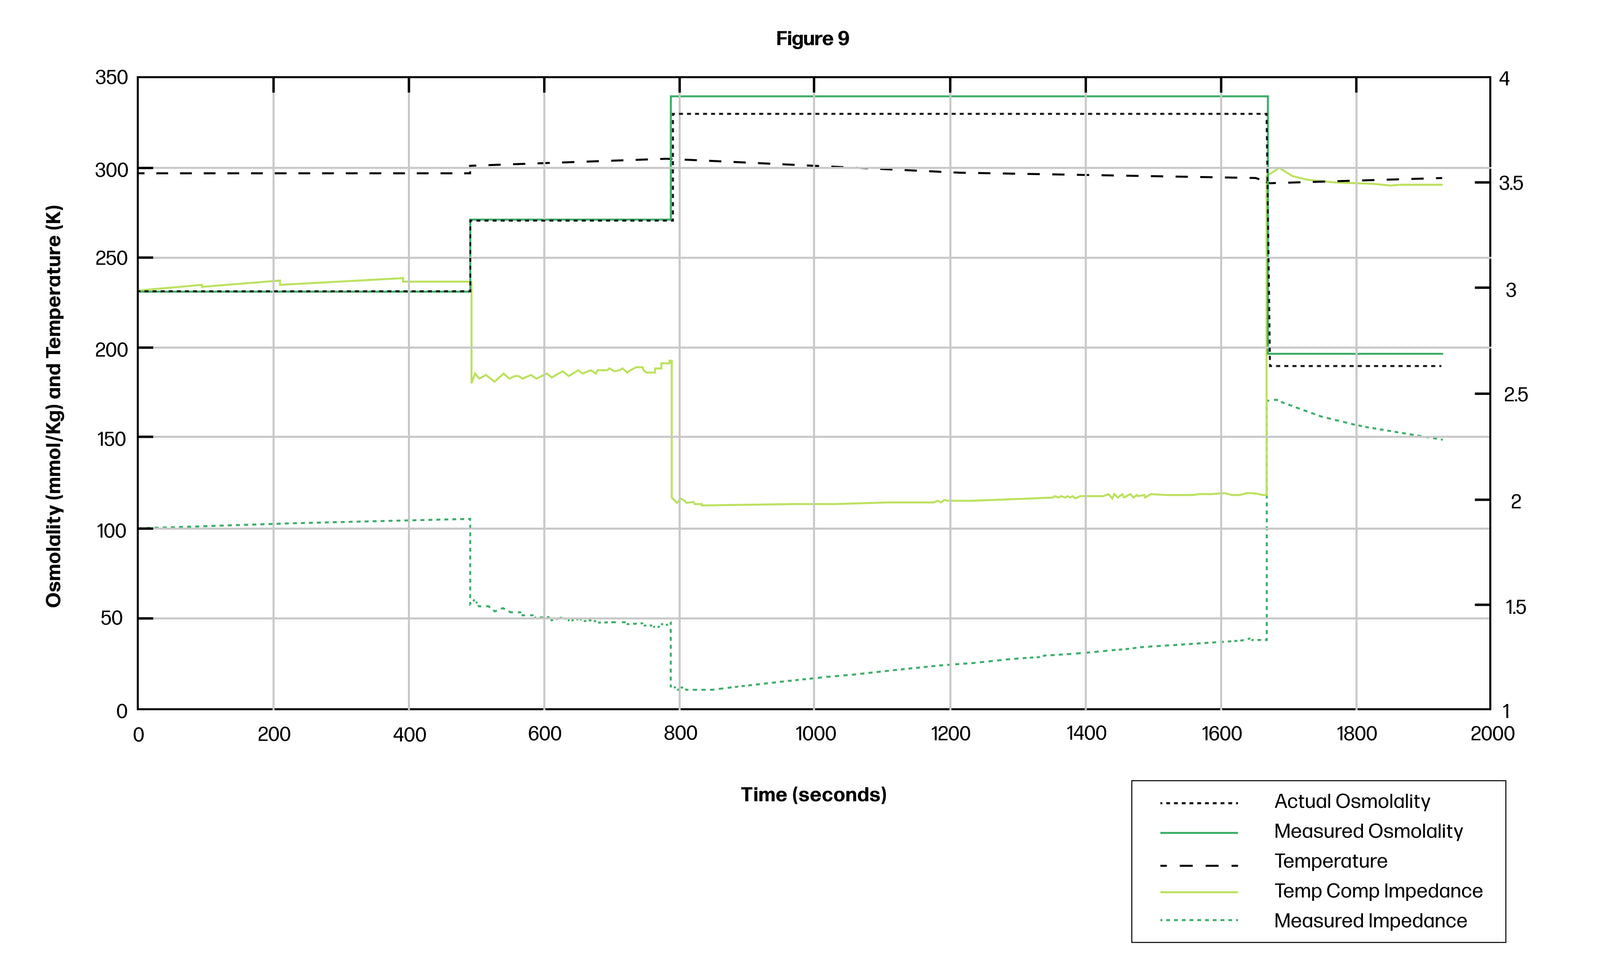
Figure 9. Raw impedance and predicted osmolality data as measured and calculated by the Nix system, compared to actual osmolality from control solutions.
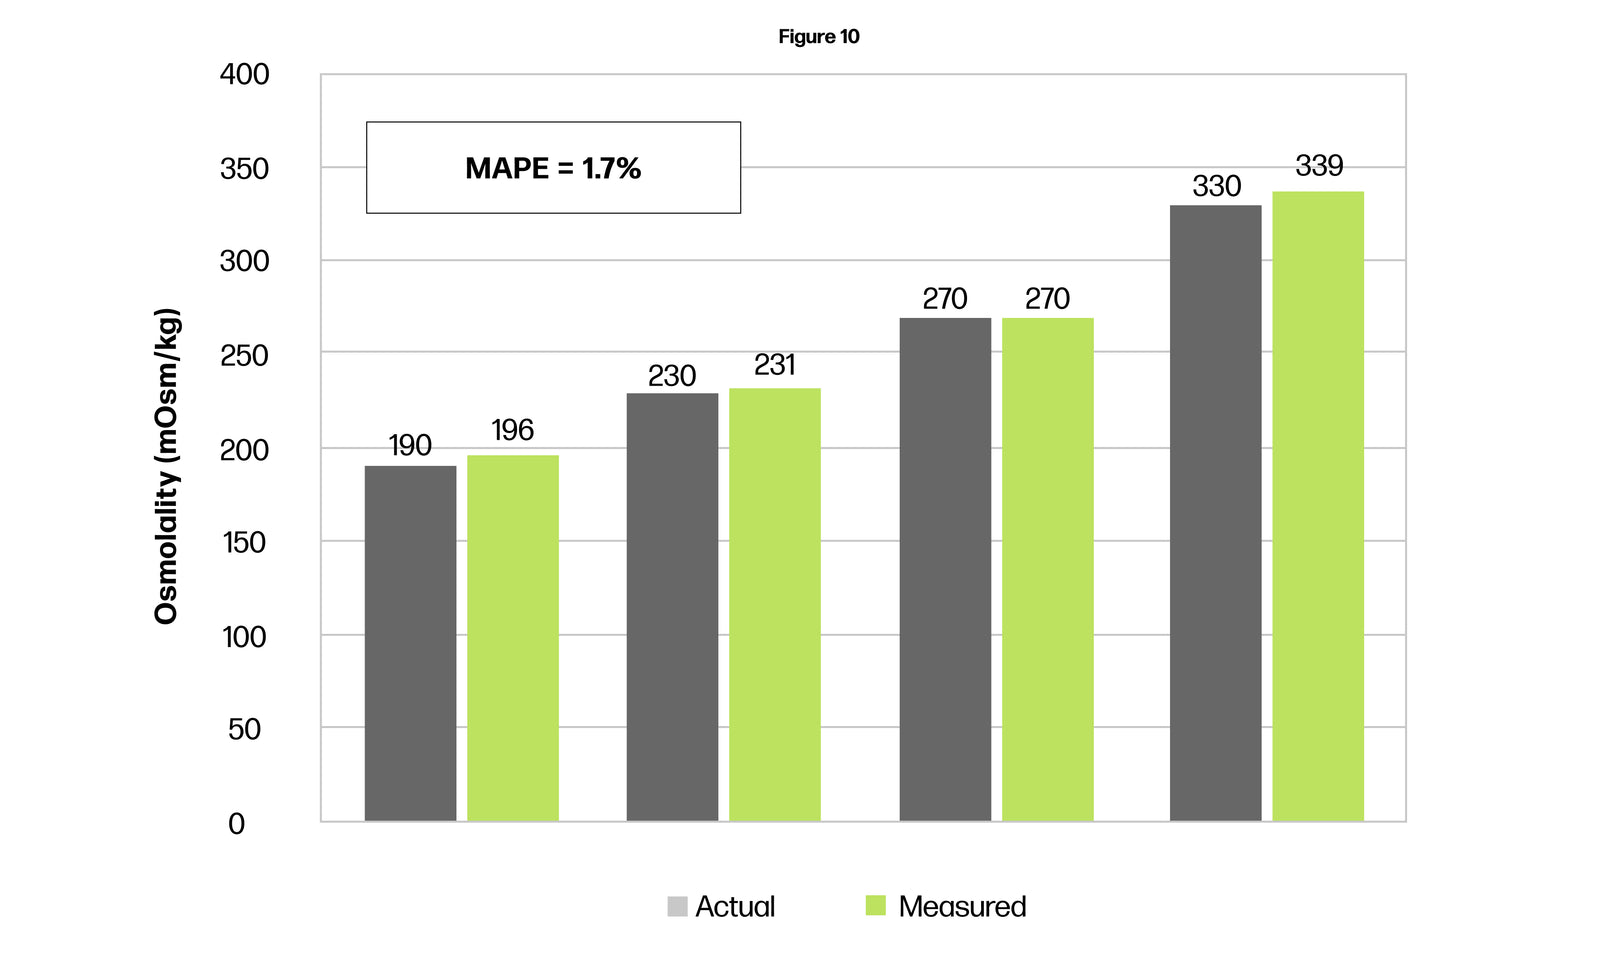
Figure 10. Error analysis of predicted osmolality data as measured and calculated by the Nix system, and actual osmolality from control solutions.
In parallel to calculating electrolyte content via osmolality, Nix’s proprietary algorithms calculate the flow rate of sweat as it passes through the flow path in the patch. As referenced in the Raw Sweat Impedance Measurement section above, Nix’s machine-learning model identifies the ΔT between the two time series of the two pairs of electrodes - Impedance A and Impedance B - in the flow path. This ΔT equals the time delay for sweat to move from the first pair of electrodes (Impedance 1) to the second pair of electrodes (Impedance 2). Given the known distance between the electrodes, the algorithm calculates the flow rate. A blinded, controlled test was performed with an injection pump pushing fluids into the patch at known flow rates. When compared to the algorithm’s calculations, the error rate was 7.8% underprediction, or precision of 93.2% (Figure 11).
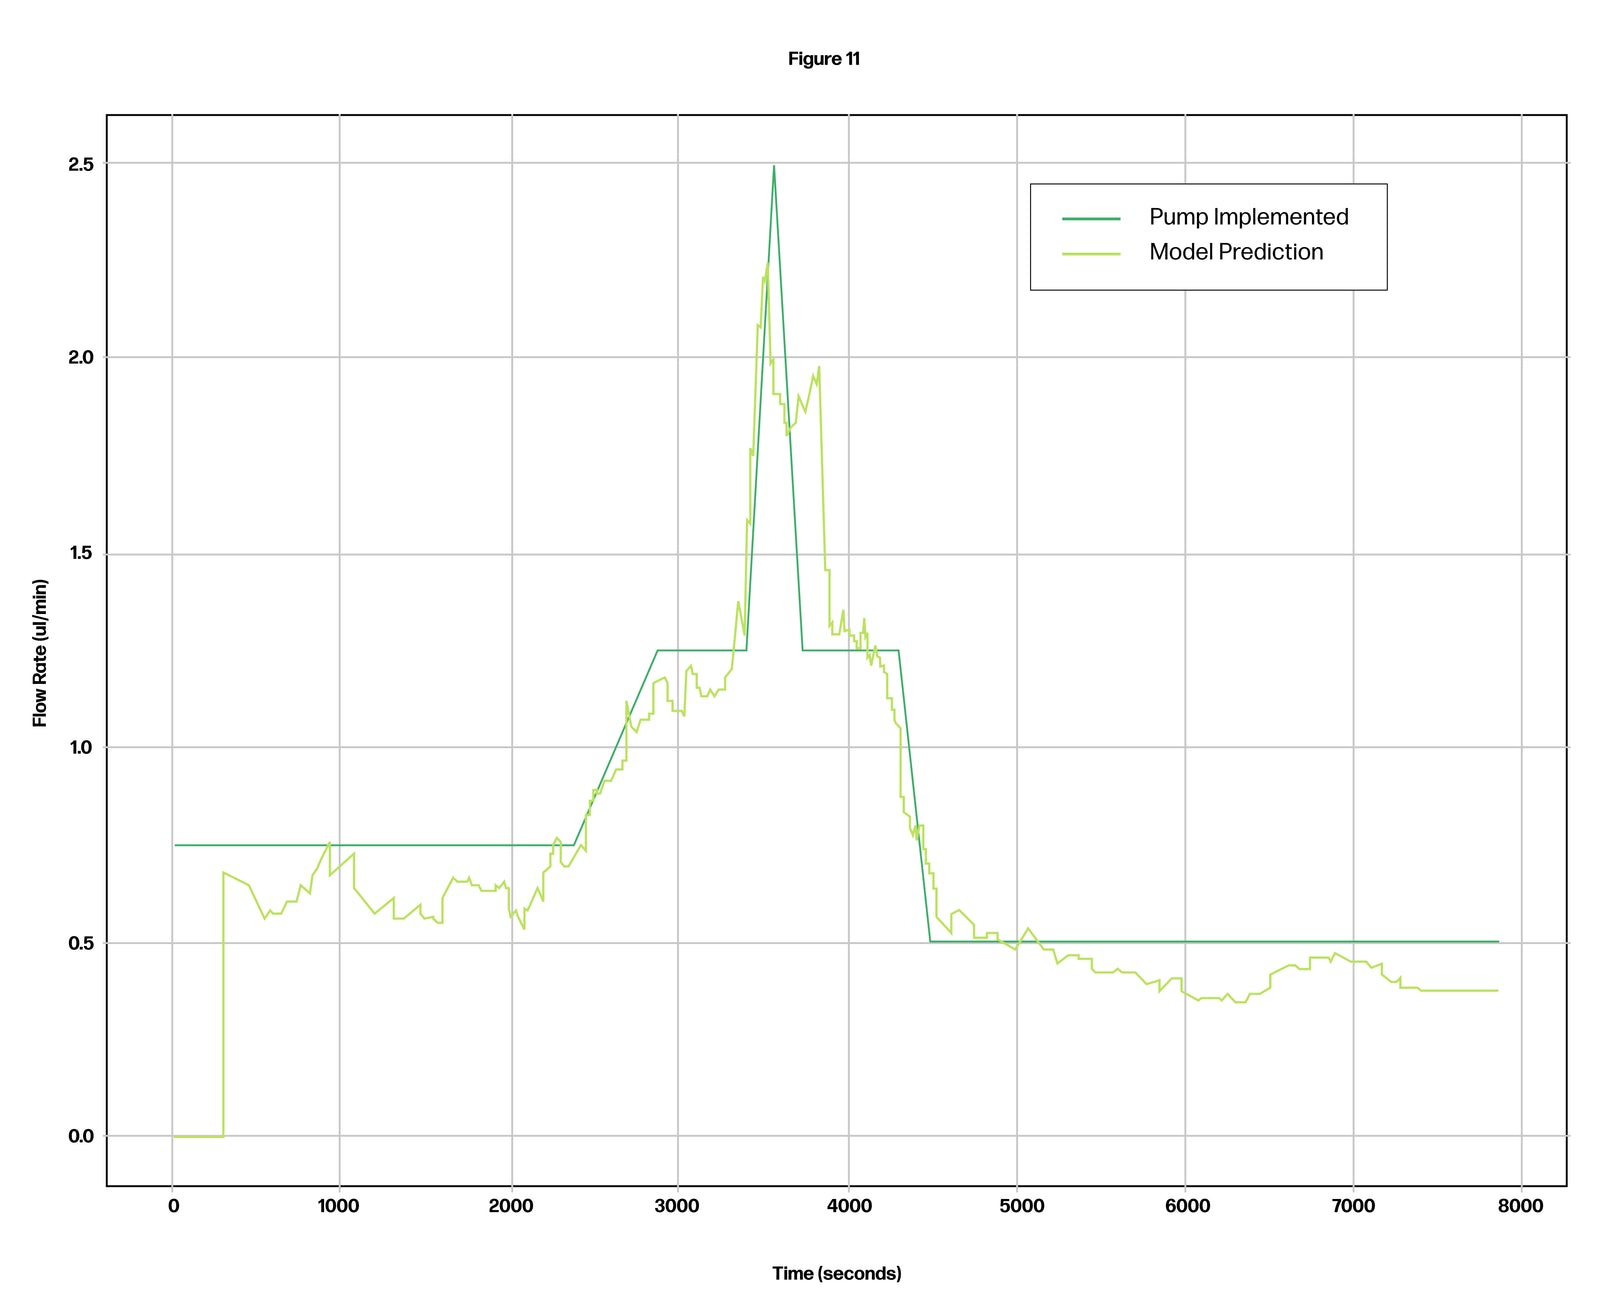
Figure 11. Controlled flow rate test comparing actual flow rate to algorithm calculations. This flow rate of sweat in the patch flow path is regarded as the sweat rate on the bicep for the specific footprint represented by the sweat reservoir. This is constitutes the local sweat rate.
The local sweat rate represents a small portion of the body’s surface area on the bicep. This local sweat rate has a certain correlation to the full body sweat rate, which is characterized among other local sweat rate correlations in a seminal paper by Dr. Lindsay Baker, Exercise Intensity Effects on Total Sweat Electrolyte Losses and Regional vs. Whole Body Sweat [Na+], [Cl-], and [K+][MU1] (Figure 12).
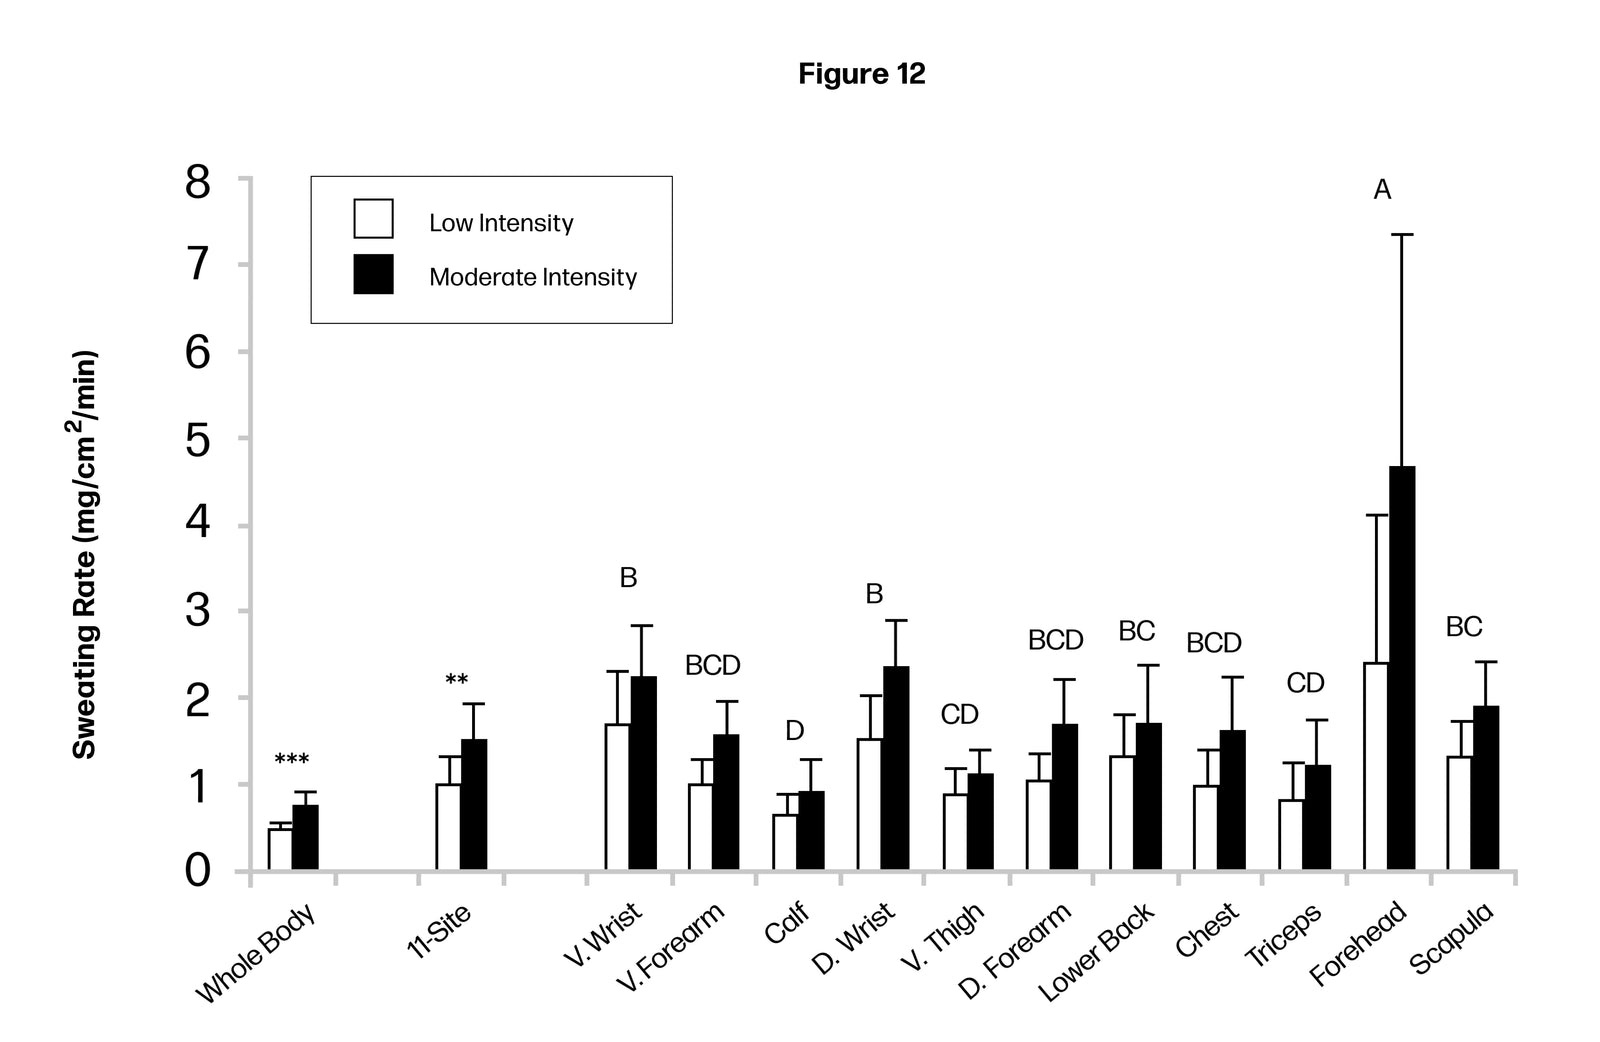
Figure 12. Sweating rate during LOW and MOD intensity trials. n = 11 for all sites except D. Wrist and V. Wrist, where n = 10. D dorsal, V ventral. **p < 0.01, ***p < 0.001, LOW vs. MOD for whole body and 11-site aggregate (paired t tests).
According to Dr. Baker’s analysis, the dorsal wrist, dorsal forearm, scapula, and forehead are among the most suitable anatomical sites for using regional measurements to predict whole-body sweat electrolyte concentrations (Figure 13). However, several of these are impractical for patch placement on an athlete in the field. Nix proprietary research shows reliable reproducibility of dorsal forearm and dorsal bicep sweat rates. As such, the bicep was selected as a practical and tolerable location for Nix patch placement.
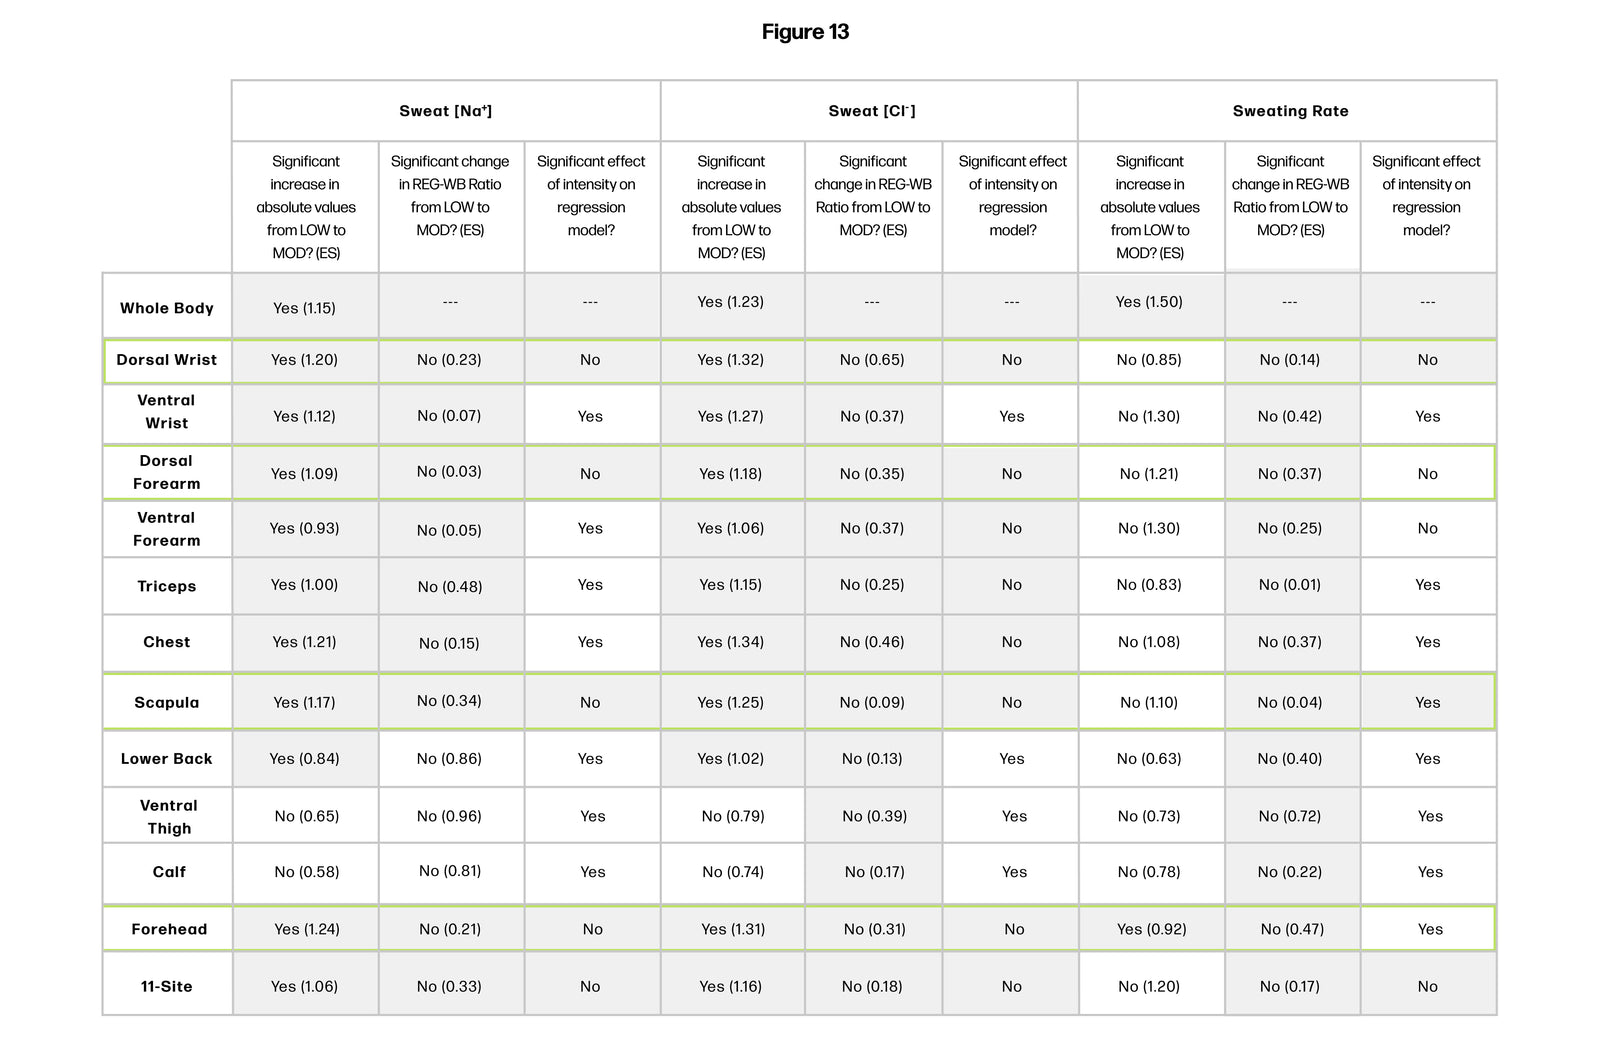
Heat map to determine most suitable sites for using regional measures to predict whole-body sweat rate. Gray areas indicate where the following criteria were met: (1) mean difference in absolute REG value between LOW and MOD p<0.05 (ANOVA followed by the post hoc analysis) and large effect size (definitions per Cohen 1988: small: <0.2, moderate: 0.2-0.8 large: > 0.8); (2) mean difference in REG-to-WB ratio value between LOW and MOD p>0.05 on the small-moderate effect size: (3) intensity or intensity-regional interaction effect p>0.05 on the regression model predicting WB from REG.
An in situ study was conducted with subjects who were blinded to sensor data. Subjects ran for 60 minutes on a treadmill without fluids. Nude body mass was taken before and after activity to measure whole body water losses. Our sensor and proprietary algorithms reported Cumulative Fluid Losses with a MAPE of 17.2 (accuracy of 82.8%), compared to the gold standard, change in nude body mass. Figure 14 shows the error profile for each subject as a percent of body mass. Note that the most inaccurate cases were still within ±1% body mass change, well below the scientifically accepted threshold at which performance impairment would be onset, of 2%.
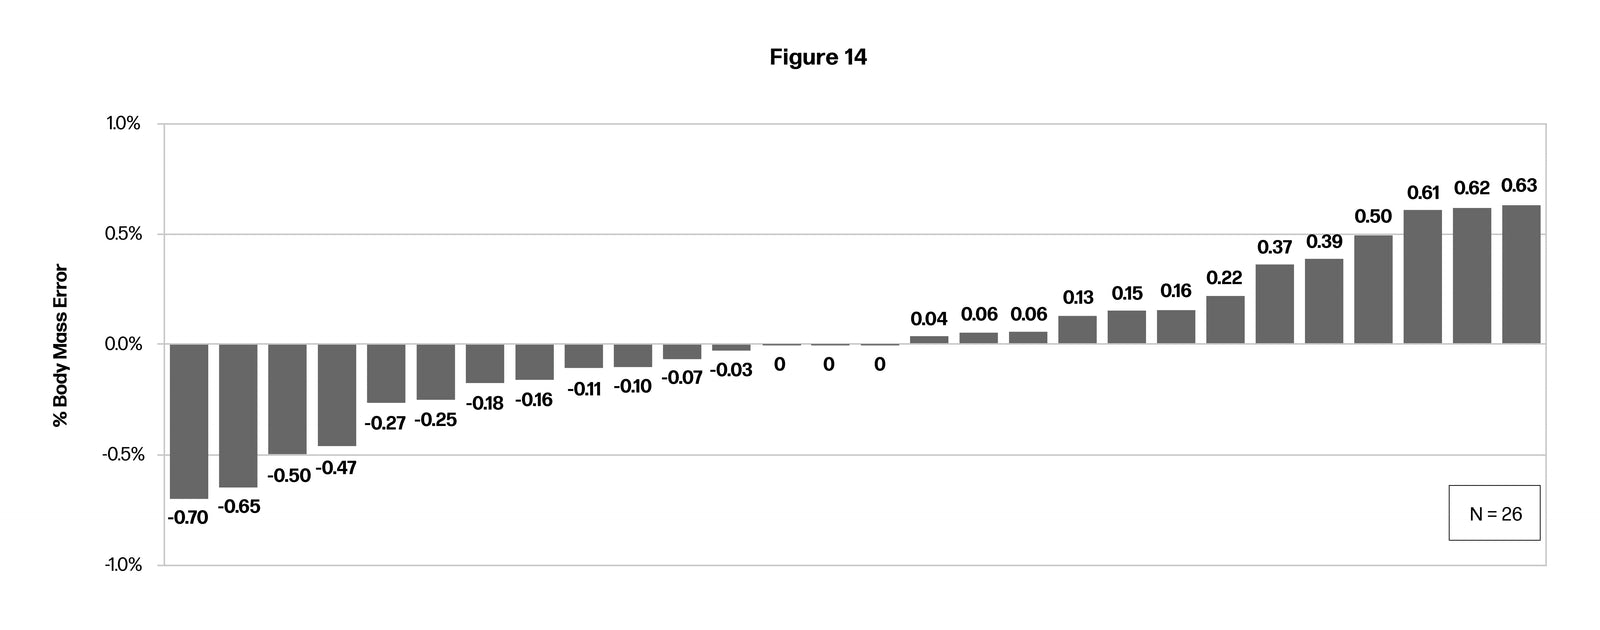
Figure 14. Accuracy of whole body fluid losses of Nix sensor as compared to gold standard body mass change.